guest@BipbopPC:~/writing$ less file-system-performance.md
File System Performance Evaluation
Dec 2023 · Linux · file systems · benchmarking
Five Linux file systems benchmarked bare-metal with IOzone across file sizes from 64 kilobytes to 2 gigabytes, on five 20 GB partitions of a dedicated SSD.
Operating Systems Final Project: File System Performance Evaluation. CSCI 440-01-2941 | Professor Dixon. Christopher Gemperle, 14 Dec 2023.
## Question
We have chosen to investigate file system performance on Linux, and which file systems are best for files of sizes varying from 64 kilobytes to 2 gigabytes.
## Experimental Setup
The experiment is set up to be run bare-metal on Arch Linux, with hardware specifications for the host machine provided in the neofetch captures featured on the right.
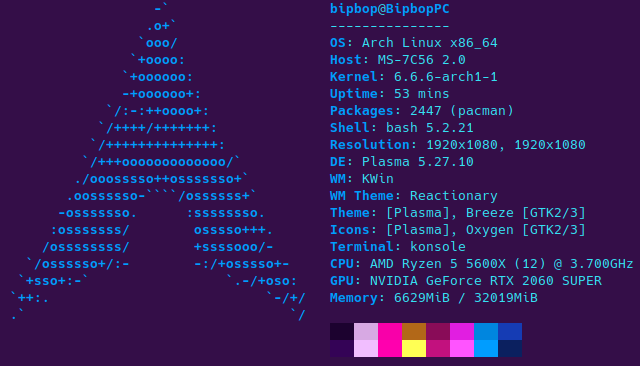
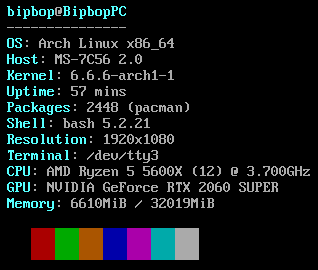
The file systems being tested have been set up in partitions on a drive currently dedicated to this project, a Kingston Q500 SSD detected second and assigned sdb by Linux. Using fdisk, five partitions were created as Linux Filesystems.
The five partitions being tested have each been allocated 20 gigabytes of space, and were formatted using mkfs as ext4, ext2, xfs, fat32, and btrfs file systems respectively from sdb1 to sdb5 using the following command:
mkfs.ext4 /dev/sdb1 && \
mkfs.ext2 /dev/sdb2 && \
mkfs.xfs /dev/sdb3 && \
mkfs.fat -F 32 /dev/sdb4 && \
mkfs.btrfs /dev/sdb5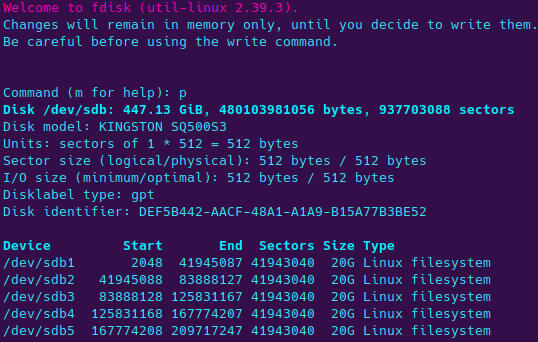
The final step in setting up our environment for this experiment was mounting the drives, which was done with the following command:
mount -m /dev/sdb1 /mnt/ext4 && \
mount -m /dev/sdb2 /mnt/ext2 && \
mount -m /dev/sdb3 /mnt/xfs && \
mount -m /dev/sdb4 /mnt/fat32 && \
mount -m /dev/sdb5 /mnt/btrfs
## Testing
IOzone was used for benchmarking, and all tests provided in the suite were used. Block sizes were set to vary between 4 kB and 16 MB, while file sizes ranged from 64 kB to 2 GB.
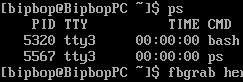
In order to minimize competition for the machine’s resources, I opened a new tty and ran “pkill -9 kwin” to kill my desktop environment and all of its children. This left me with an environment that was as pure as I could make it without making a gentoo install specifically for this or setting up a Linux From Scratch build with nothing but the file system programs, IOzone, and IOzone’s dependencies.
## Performing the Ritual
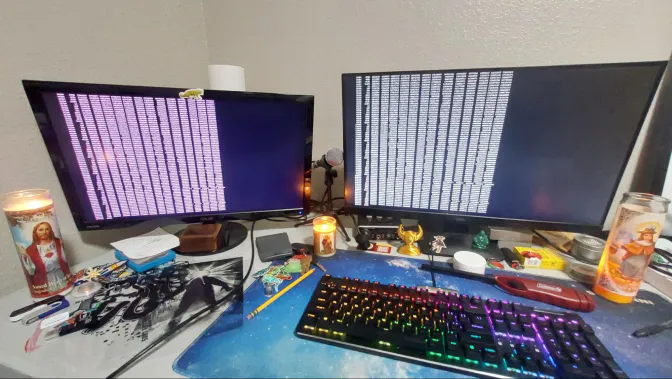
The ritual must be completed carefully, one step at a time. Use of religious paraphernalia is strongly recommended.
- * Enter each mounted partition and run the following line in bash: sudo iozone -a -g 1G -b result_file.xls -f test_file > test_results.txt
- * Change permissions so that all worldly users may access the data.
- * Copy files into project directory and run the UNDOCUMENTED AND UNALIASED Generate_Graphs script that was just sitting in the IOzone repo for some reason on the generated test_results.txt files.
- * Show gratitude to Saint IGNUcius.
## Data
### BTRFS:
### EXT4:
### EXT2:
### FAT32:
### XFS:
## Test Results - Accuracy
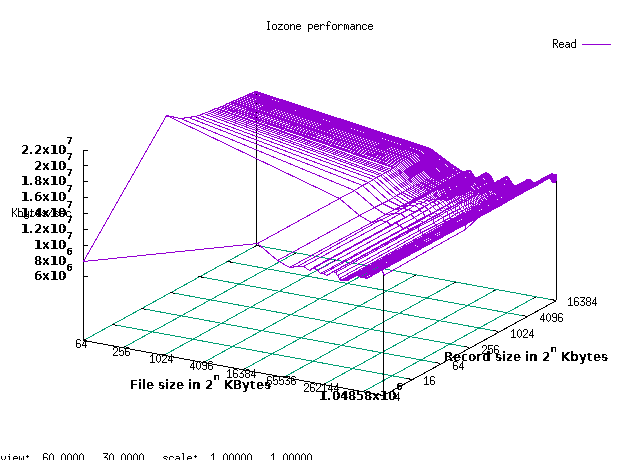
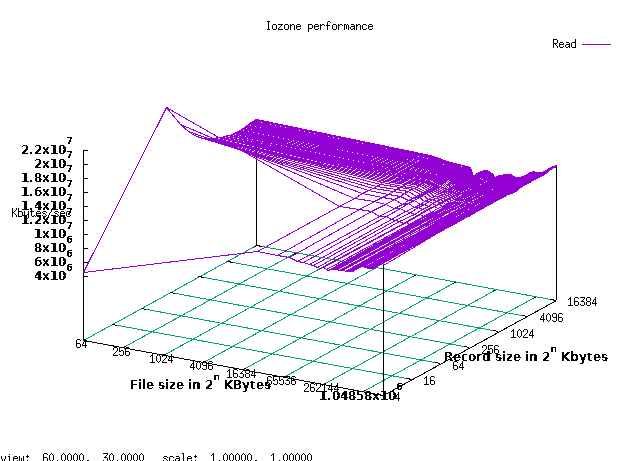
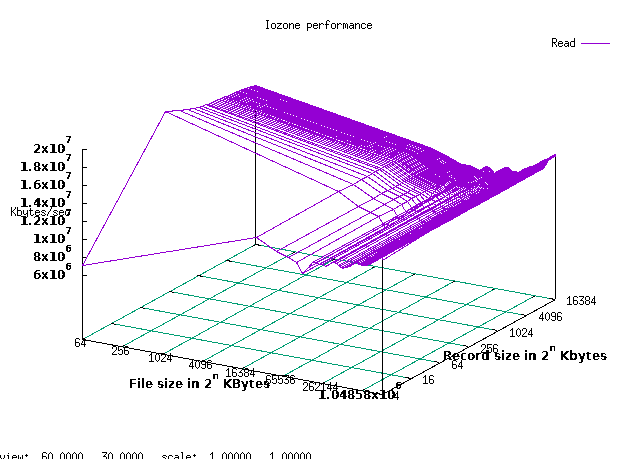
Determining the accuracy of our data is difficult because of how long a trial takes. As of right now, only one trial is being done per block size / file size pair. Running more trials and averaging the results would increase the accuracy of our data, especially since there do appear to be some hiccups in the graphs where the data trends in the direction opposite of what would be expected, such as FAT32 128 MB read trials, but the dip in read speed at 128 MB appears consistently through all block sizes at that file size in FAT 32. This could either indicate that more trials needed to be run, or that FAT32, for some reason, slows down going from 64 MB to 128 MB files.
However, because the metric we obtain from these trials is a rate determined over a sometimes fairly long period of time while the files are being written to and read from, only having one trial isn’t as big of an issue as it would be for other types of metrics.
## Test Results - Variation
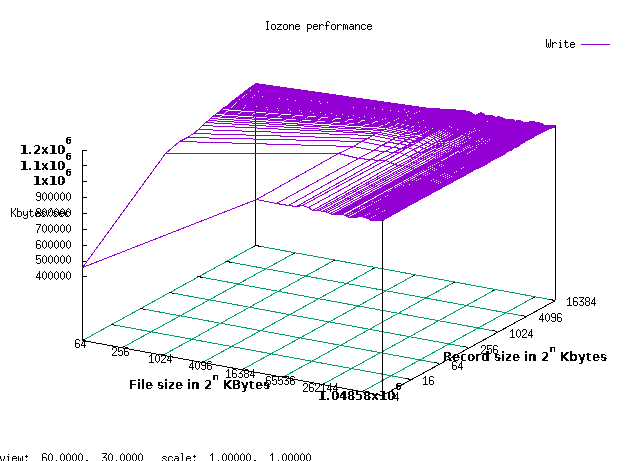
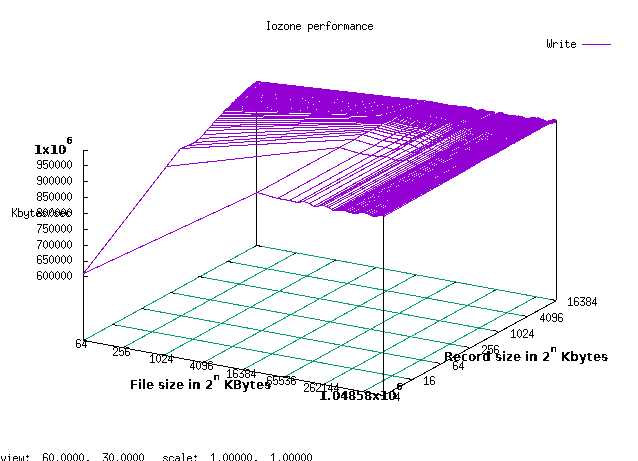
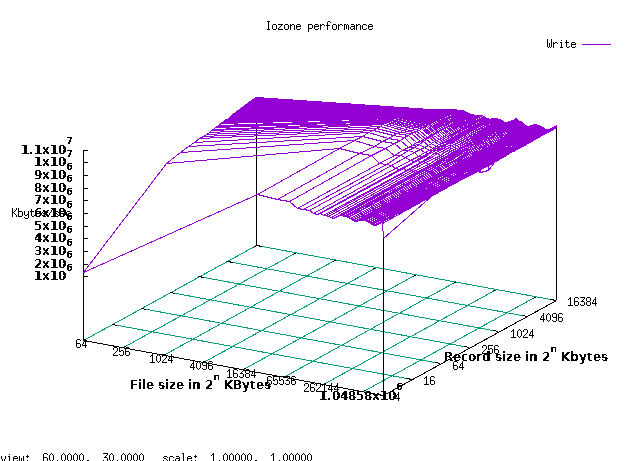
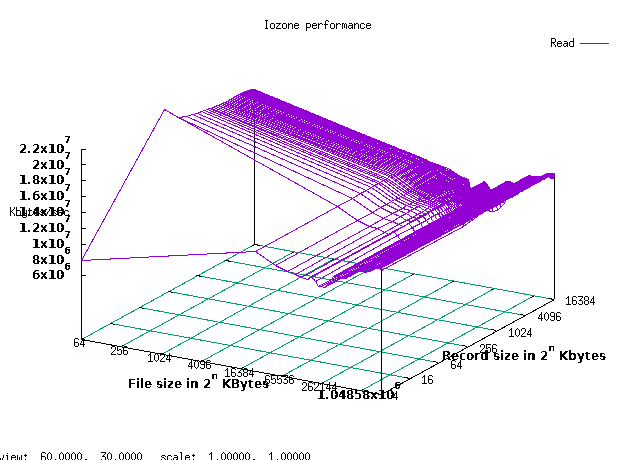
Varying block sizes from 4K to 16M and file sizes from 64K to 2G appears to have been enough, as the graphs, for the most part, appear to plateau at the furthest positive ends of the x and y axes.
## Note
All data and graphs for all read and write functions tested are included in the project folder. Only read and write were used in this report because having 13 graphs per page would be a little overwhelming, and reading and writing are the main things we usually care about.
## Conclusion
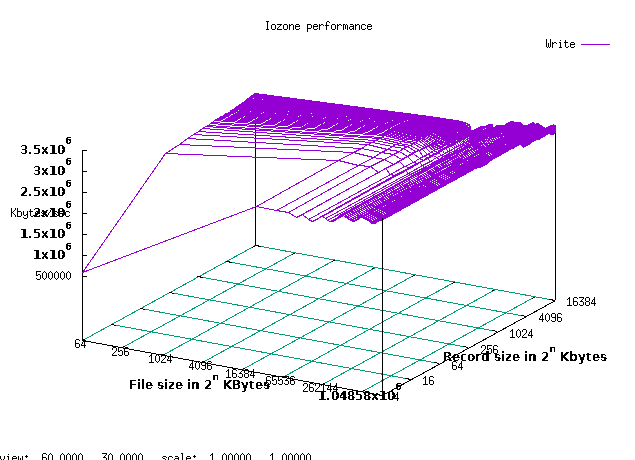
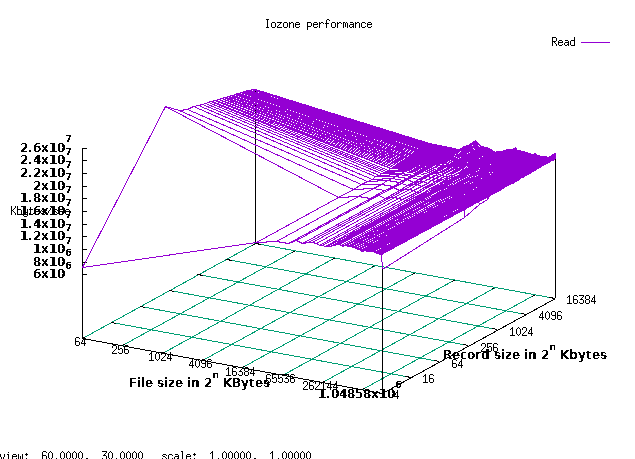
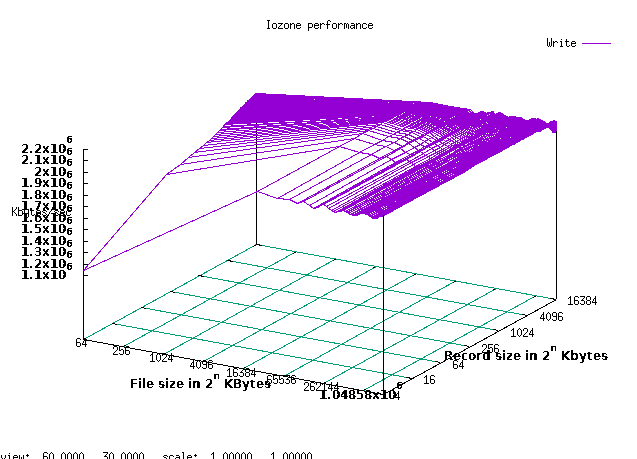
BTRFS, according to our data, is a clear winner with a high write speed of 3.5x10⁷ kilobytes per second. Suspiciously, this is faster than its read speed of 2.2x10⁷ kilobytes per second, but the write speed in the graph appears so consistent that I’m not going to question it.
I’m very comfortable with most of the tools I used in this project, but this is the first time I’ve used IOzone, so I could probably say that using that benchmarking tool is what I learned from this project. I suppose I also learned that BTRFS is actually a really fast file system, and I should probably consider switching my root partition to it the next time I screw Linux up so badly that the kernel panics become too frequent and too hard to triage to handle. Aside from this, I learned a bit about topics that didn’t make it into my final project, such as plotting with GNU Octave and GGPlot in R. I had initially planned to use R, but decided having 3d plots would look nicer, and after fiddling around with GNU Octave and getting some basic plots of my data, I decided to use GNUPlot since it seemed to be what everyone else used for plotting IOzone data and was well documented for that purpose.